News · Environment & Climate
Sea surface temperature biases shift the North Pacific jet stream southward, study finds
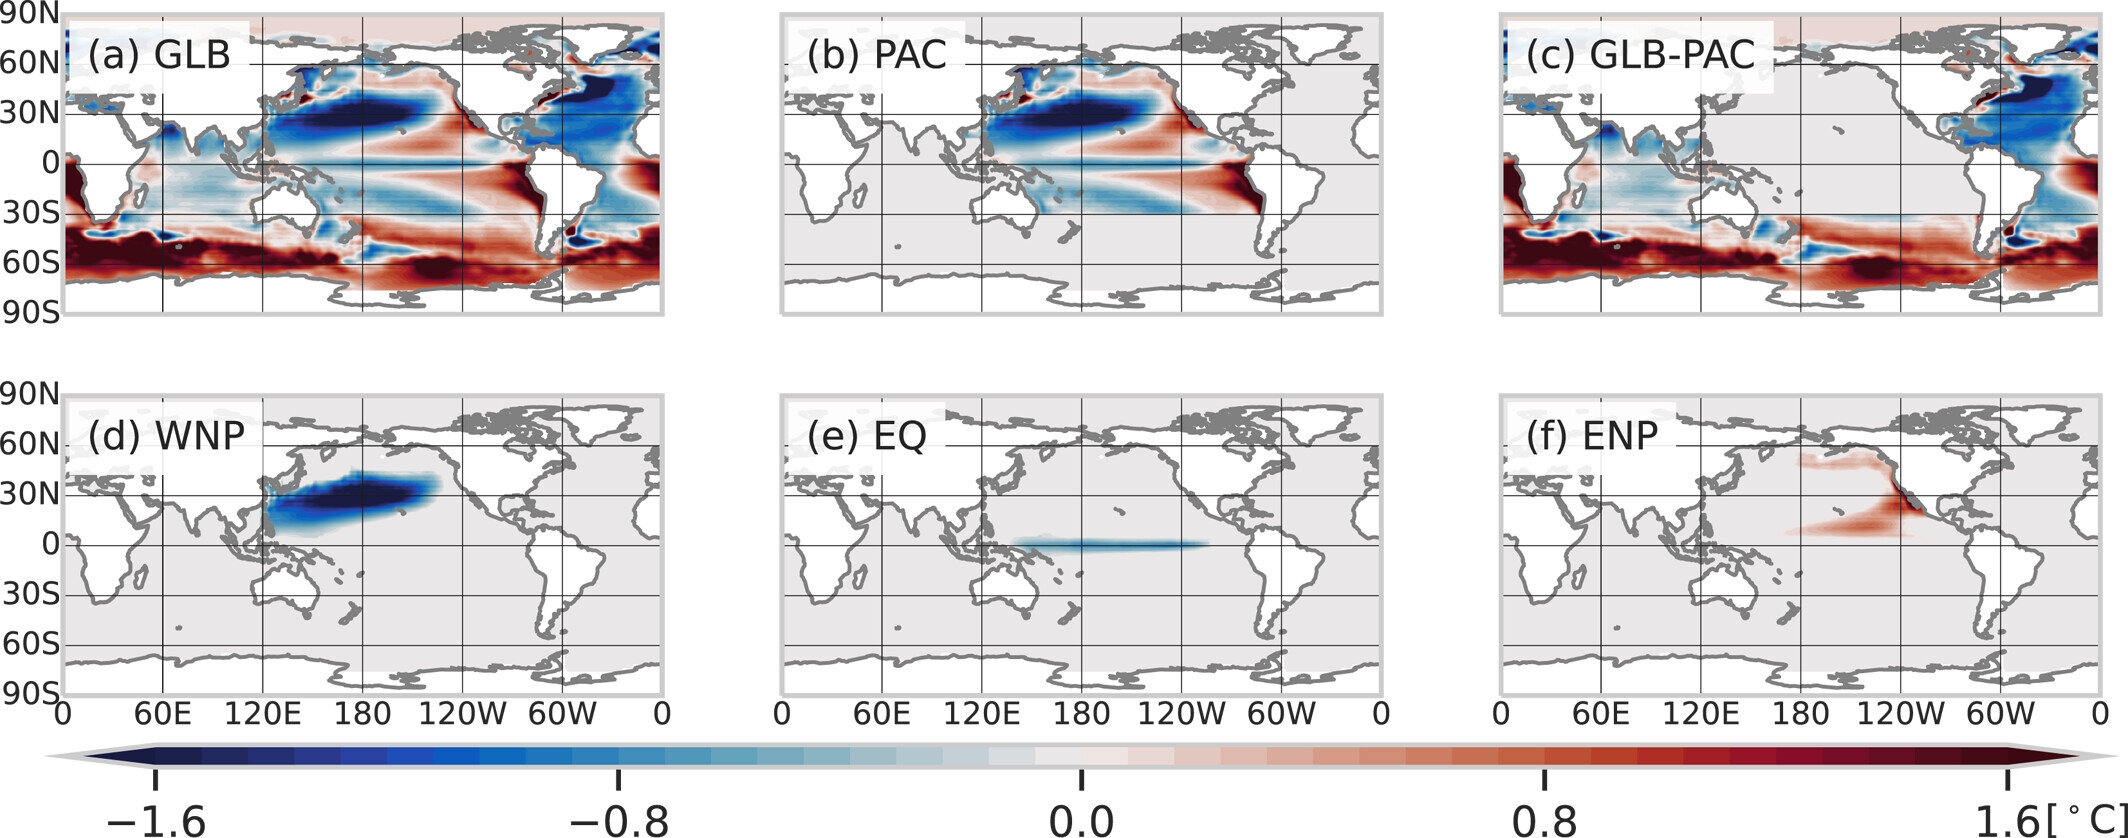
Climate models can reproduce broad climate behavior while still placing important features incorrectly. The study found that biases in simulated sea-surface temperatures were linked to an incorrect position of the North Pacific jet stream. This matters because the jet guides storms and influences weather across large regions. A key example is a jet stream that sits too far south. Differences between simulated and observed ocean temperatures can alter heating of the air above the ocean. That changes pressure patterns and winds, helping steer the jet along a different path. The relationship is not simply an ocean error staying in the ocean; it spreads through the atmosphere. The article explains that present-day simulations contain various biases, and that the same model characteristics can affect future simulations. Therefore, identifying the sea-surface-temperature errors behind the jet-position bias can improve confidence in climate projections. The excerpt does not give numerical results, but it clearly frames these biases as important sources of uncertainty.
Based on reporting by Phys.org
What did the study find about sea-surface-temperature biases and the position of the North Pacific jet stream?
Climate models can reproduce broad climate behavior while still placing important features incorrectly. The study found that biases in simulated sea-surface temperatures were linked to an incorrect position of the North Pacific jet stream. This matters because the jet guides storms and influences weather across large regions.
A key example is a jet stream that sits too far south. Differences between simulated and observed ocean temperatures can alter heating of the air above the ocean. That changes pressure patterns and winds, helping steer the jet along a different path. The relationship is not simply an ocean error staying in the ocean; it spreads through the atmosphere.
The article explains that present-day simulations contain various biases, and that the same model characteristics can affect future simulations. Therefore, identifying the sea-surface-temperature errors behind the jet-position bias can improve confidence in climate projections. The excerpt does not give numerical results, but it clearly frames these biases as important sources of uncertainty.
What is a sea-surface-temperature bias in a climate model?
Sea-surface temperature, or SST, is the temperature of the ocean’s upper surface. A bias occurs when a climate model repeatedly represents that temperature incorrectly. The error may affect one location, a broad ocean region, or the pattern of warm and cool water. It is called a bias because it is a systematic difference, not just random day-to-day variation.
For example, a model might simulate part of the Pacific as warmer than observations show. That warm error changes how much heat and moisture the ocean supplies to the air above it. The resulting changes in pressure, clouds, and winds can influence larger circulation features, including the North Pacific jet stream. Thus, an SST bias can affect weather far from the original ocean region.
The article says present-day climate simulations do not perfectly reproduce observations and contain various biases. It also warns that model characteristics causing today’s errors can affect future simulations. Measuring SST biases against observations is therefore an important step in evaluating and improving climate models.
What is the North Pacific jet stream, and where is it located?
The North Pacific jet stream is a fast-moving ribbon of air high in the atmosphere. It forms near the boundary between colder air to the north and warmer air to the south. Because Earth rotates, strong temperature contrasts help organize the winds into a mostly west-to-east flow. The jet is especially important for steering storms across the Pacific.
It generally stretches from near East Asia, including Japan, across the North Pacific toward western North America. Its typical position is in the midlatitudes, roughly 30–45 degrees north, though it bends and shifts. The jet is not a solid tube with a fixed edge. It meanders, strengthens, weakens, and changes position over time.
The article focuses on how climate models represent this feature and how sea-surface-temperature biases affect its simulated location. Getting the jet’s position right matters because it helps determine where storms travel and where weather systems bring rain, snow, or unusual temperatures. A misplaced jet can therefore create broad regional errors.
How large is the North Pacific jet stream—how far does it extend and how fast can its winds blow?
The North Pacific jet is enormous compared with everyday weather systems. It extends roughly 10,000 kilometres from the region near Japan across the Pacific toward western North America. Its path is usually eastward, but it can curve and meander. The jet occupies the upper troposphere, several kilometres above the surface, rather than hugging the ground.
Its wind speeds are also extreme. Strong sections commonly blow at about 30–70 metres per second, or roughly 110–250 kilometres per hour. The fastest core can exceed 200 miles per hour, although speed varies along the jet and from season to season. These winds are concentrated in a relatively narrow zone.
The supplied article excerpt does not give the jet’s size or wind-speed figures; these are established atmospheric-science descriptions. The scale explains why its position matters so much. A shift of a few degrees can redirect storms across wide areas, affecting rainfall, snowfall, temperatures, aviation, and regional weather patterns.
What weather patterns can change when the jet stream shifts southward?
The jet stream acts like a steering track for large weather systems. When it shifts southward, the preferred route for storms and low-pressure systems also tends to move south. This can change where rain and snow fall, how often storms arrive, and which regions experience prolonged dry spells. The effects depend on the shift’s size, shape, and season.
For example, a southward jet can increase storm activity and precipitation in areas farther south than usual. Regions north of the displaced storm track may receive fewer storms and become drier. The jet’s bends can also create persistent weather patterns, such as repeated storms in one area or unusually mild, cold, wet, or dry conditions elsewhere. These are circulation changes, not just local temperature changes.
The source article connects jet-stream position with sea-surface-temperature biases in climate models. That connection matters because models may misplace storm tracks if they misplace the jet. The excerpt does not list specific regional impacts, so these weather consequences come from established meteorological understanding rather than details stated directly in the article.
How can errors in simulations of today’s climate affect projections of future climate change?
Climate models begin by simulating the climate system, including the atmosphere, ocean, and other components. Scientists compare those simulations with observations to find biases. The article stresses that present-day simulations do not perfectly reproduce reality. Those errors matter because the model features producing them can remain active when the model projects future climate.
For example, if a model has a sea-surface-temperature bias that places the North Pacific jet too far south today, it may also simulate an inaccurate storm-track response to future warming. The problem can affect projected rainfall, temperatures, and regional circulation. The model may still capture broad global changes while missing important local or regional details.
This does not mean every future projection is unusable. It means projections should be evaluated against present-day observations and interpreted with uncertainty. Understanding the causes and impacts of current biases can guide model improvement and help researchers judge which projected changes are more reliable. The article presents this diagnosis as central to climate-model research.
How do ocean temperatures and the atmosphere interact to shape large-scale wind patterns such as the jet stream?
Ocean temperatures help shape the atmosphere because the ocean stores and releases enormous amounts of heat. Warmer water generally supplies more heat and moisture to the air above it, while cooler water supplies less. These differences create contrasts in air temperature and pressure. Earth’s rotation then helps turn the resulting large-scale flow into organized west-to-east winds.
Across the Pacific, patterns of warm and cool water can change where air rises, sinks, and moves horizontally. Those changes alter pressure gradients and the temperature contrast between lower and higher latitudes. The upper-level winds respond, strengthening, weakening, or shifting the jet stream. The atmosphere also affects the ocean through winds, evaporation, clouds, and currents, so the interaction works in both directions.
This ocean-atmosphere link explains why sea-surface-temperature biases can produce a misplaced North Pacific jet in a model. The source article emphasizes that models simulate both the ocean and atmosphere, but do not perfectly match observations. Improving their interaction is therefore important for more trustworthy climate projections.
Key Facts:
📌 Sea-surface-temperature biases were linked to a southward jet-stream displacement.
📌 Ocean-temperature errors can alter atmospheric circulation.
📌 Present-day biases may affect future climate projections.
📌 An SST bias is a systematic ocean-surface-temperature error.
📌 Biases can be too-warm, too-cool, or wrongly patterned.
📌 SST errors can influence atmospheric winds and circulation.
📌 The North Pacific jet is a powerful upper-atmosphere wind band.